
The Problem
Solid samples in general can suffer from a considerable amount of surface non-homogeneity. Placement of textured samples, such as fabrics with a defined weave, can lead to differing diffuse reflectance spectra that are dependent on sample position and orientation. The problem is more acute with samples that have large area regular patterns.
There are two issues that relate to this variation. First, the depth of these surface patterns results in greater spectral variation associated with deeper surface features. Second, the regularity of the surface features results in greater spectral variation that is dependent on uniformity of these features. The reason for this phenomenon arises because the surface features act as “light traps” that prevent a certain amount of reflected light from “escaping” the sample to enter the sphere for measurement. An example of this type of behavior is shining a flashlight into a cave. The deeper the cave, the less light comes out to be collected by your eyes.
Randomly distributed surface features usually result in minimum variation with sample positioning. This type of random surface scenario is seen in the figure below.

The Solution
Most integrating spheres have a rather large beam size on the sample, usually about 8 mm by 10 mm depending on the instrument and sphere combination. This yields a large surface sampling area and is helpful in averaging out sample non-homogeneity. For certain difficult samples it is not unusual to measure and average the spectra from several places on a solid sample. However, for many patterned samples, a large instrument beam is not sufficient to remove all artifacts of sample placement.
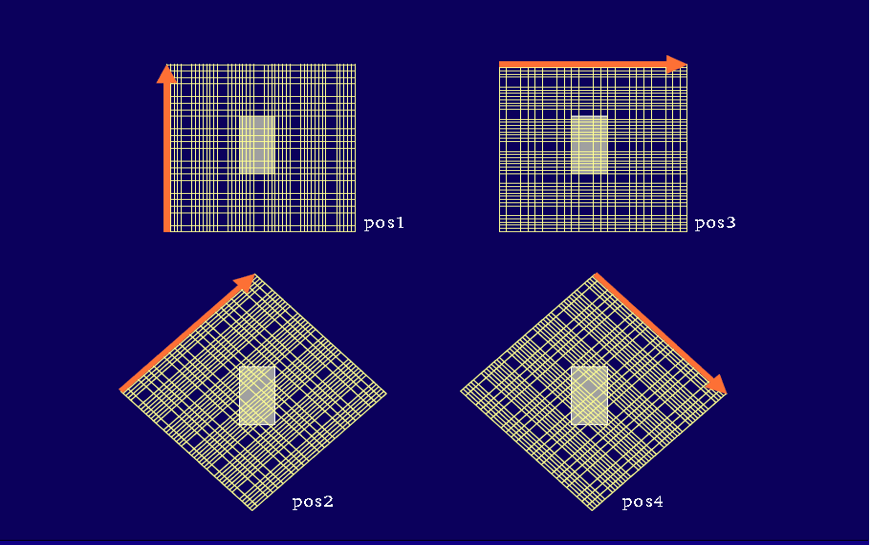
For samples with a distinct surface texture or pattern, the orientation of the sample around the beam axis can result in different spectra. The picture below demonstrates a woven fabric sample with a regular weave. We will investigate orientation effects by measuring the fabric in four unique positions in the beam. The four positions rotate the sample around the central beam axis by both 45 degrees and 90 degrees. Note the orange orientation arrow on the sample to follow the individual rotations. The lighter rectangle in the weave represents the instrument’s beam on the sample.
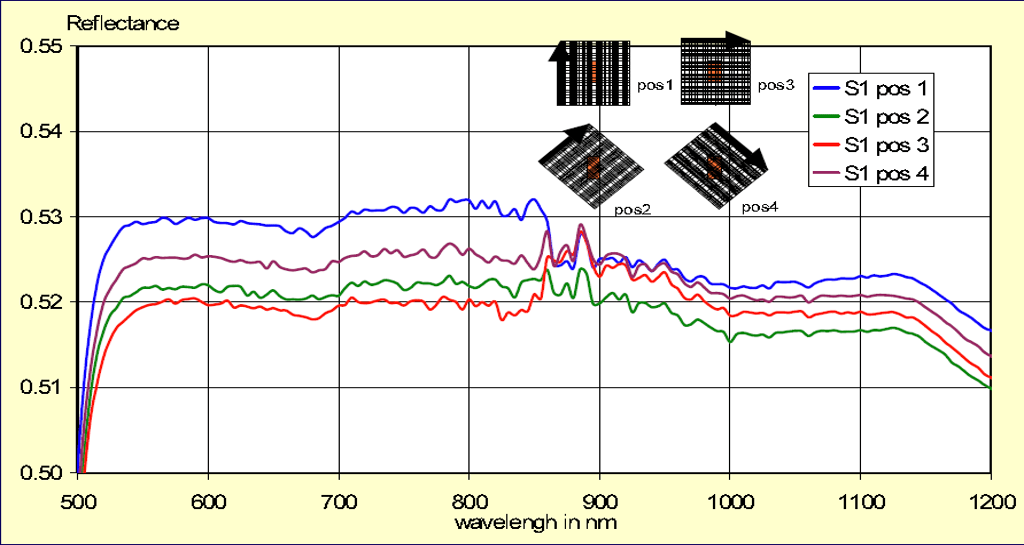
Set 1 data is generated by a sample with a very modest surface texture resulting from the weave. Spectra are obtained for the entire wavelength range of the integrating sphere from 250 nm to 2500 nm. Note there is little variation in the ultra-violet and shorter visible wavelength regions; however, at longer NIR wavelengths variations increase. The reasons for this behavior is straightforward. Textured fabrics cast shadows based on the depth and size of the weave. The amount of shadow area changes as a function of weave rotation. The wavelength dependent variation is due to the amount of scatter based on the size of the wavelength and the size of the sample texture features.

Set 2 data originate from a cloth with a much coarser and raised weave in the fabric. Note how a more pronounced surface texture results in dramatic reflectance differences as a result of sample orientation. For this sample the differences are throughout the wavelength range of UV/Vis/NIR.

This spectra below are an enlargement of the set 1 data region in the vicinity of the visible/near-infrared detector and monochromator grating change point. It illustrates an unusual point. Note how positions 1 and 3 have a small step at the change point. These sample orientations place the weave structure at orientations parallel and perpendicular to the beam geometry; whereas, positions 2 and 4 are in between these angles. The detector/grating change steps for orientation 1 and 3 are most likely due to a small mismatch in slit widths between the visible and NIR regions which resulted in a change in beam size on the sample. This beam size is dependent on the lines per mm (blaze angle) difference of the visible and NIR gratings. Typically the slits are set larger in the NIR (usually 4X larger) to maintain the same sample beam image.
The step could also be from the “grating polarized” light of the instrument interacting with the smaller weave of the set 1 sample. If so, then placing a polarization scrambling crystal prior to the sample would eliminate the step.
The take home message. Diffuse reflectance samples that have a regular surface texture must be measured at various orientations and across multiple sampling sites on the material, then averaged.
