Abstract:
A UV-Vis-NIR spectrophotometer is a powerful tool for investigating absorbance, transmittance and reflectance characteristics of materials. Although we are accustomed to seeing extremely flat baselines in these spectrophotometers, thanks to the implementation of double-beam hardware and baseline correction functions, it is important to understand what the “raw” data looks like in order to investigate if the instrument is performing as expected. In this regard, we investigate the energy profile in a typical scanning spectrophotometer which employs multiple light sources and detectors. In addition, this paper will also briefly touch on the topic of polarization arising from the plane of grating lines in the monochromator of spectrophotometers. All the spectra presented in this brief technical note are single beam energy spectra. The energy mode of a spectrophotometer is usually reserved for instrument service diagnostic purposes. As such, one would not normally use the energy mode to measure a sample. In energy mode the instrument is acting as an uncalibrated radiometer in that it is directly measuring the light intensity of the sample beam radiation on the detector. The energy of the sample beam is measured without any ratioing or comparison with the reference beam. The output energy intensity units are all relative to the gain setting on the detector. One should never infer spectrophotometer sensitivity from just the magnitude of the energy scale. However, if the gain settings are identical for two energy spectra, one can make statements about the amount of energy in each spectra reaching the detector.

The figure here shows a simple single beam optical design for a UV/Vis instrument. Instrumental energy is always evaluated in single beam mode. The term dispersive indicates that the instrument “disperses” white light with either a prism, or more commonly, a diffraction grating. There are four basic components to a simple single beam UV/Vis spectrophotometer, a light source, a monochromator, a sample, and a detector. The monochromator of the instrument is composed of an entrance slit (to narrow the beam to a usable size), a dispersion device (usually a diffraction grating that separates polychromatic white light into bands of monochromatic light), and an exit slit (to select the desired monochromatic wavelength).
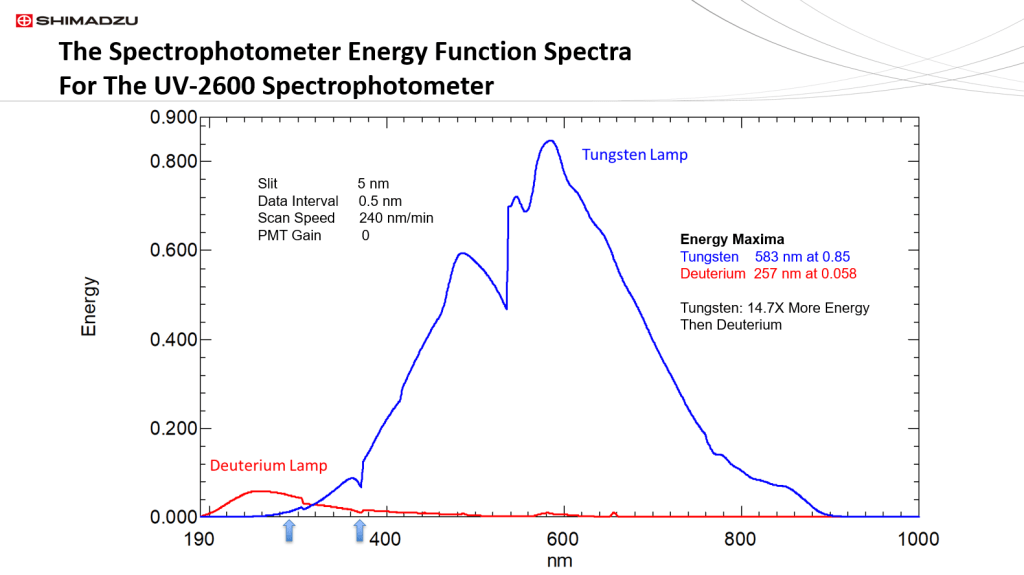
The Shimadzu UV-2600 spectrophotometer energy function is typical of most UV/Vis instruments. The instrument has a photomultiplier tube for a detector, with a range of 185 nm to 900 nm. As an accessory, an InGaAs detector integrating sphere can be fitted onto the instrument. Displayed here is the energy distribution spectra of the tungsten and deuterium lamps at the same PMT gain setting. Additionally, both energy spectra were measured with identical instrumental parameters of slit, data interval, and scan speed. Typical of two lamp spectrophotometers, the deuterium lamp UV region is less energetic than the visible and short wavelength NIR regions. Note also that the tungsten/deuterium lamp change-over wavelength point can be set between 290 nm to 370 nm. This is the wavelength region between the two blue arrows; however 323 nm is the default optimal change-over point. This is also the wavelength where the tungsten and deuterium energy spectra cross over each other. The energy spectrum of the tungsten lamp, that covers the wavelength region from 323 nm to 1400 nm has much greater energy than the deuterium lamp. Since the PMT gain was the same for both lamp regions, a comparison can be made about peak energy levels for each lamp. At their peak wavelengths, the tungsten lamp has 14.7 times more energy than the deuterium lamp.
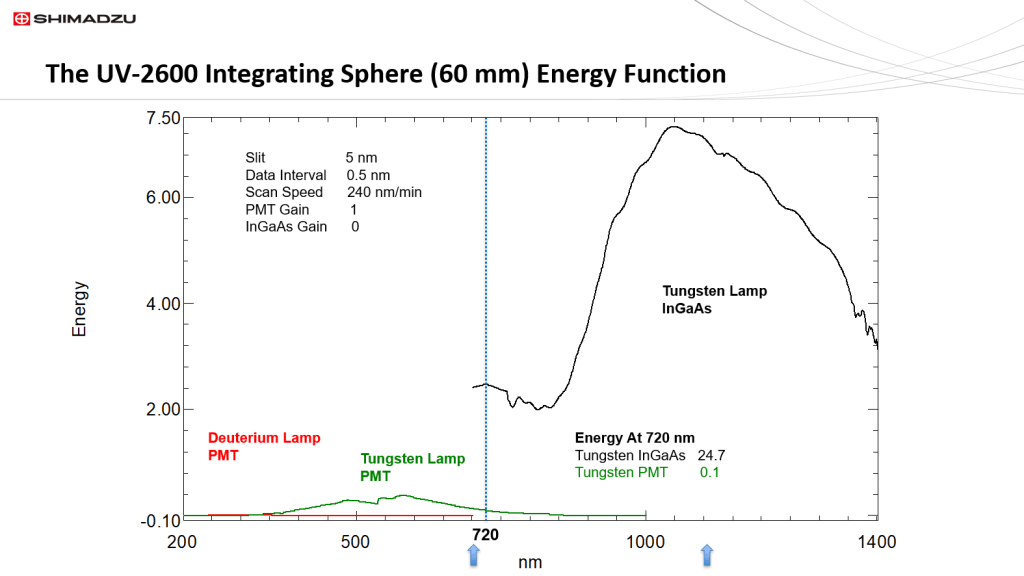
A sphere functions by collecting reflected or transmitted light after it bounces within the sphere multiple times. These multiple, internal sphere reflections tend to decrease the energy that finally strikes the detector. As a result, sphere measurements are usually less energetic, and nosier, than their standard instrument detector counterparts. A 60 mm sphere reduces the energy by about 80%. This is reflected in the energy spectra here by the higher PMT gain setting of 1 needed to collect a detectable energy signal.
The UV-2600 spectrophotometer’s 60 mm sphere has both a PMT for the UV/Vis region and a more sensitive solid state InGaAs detector for the short near infra-red (NIR) region (900 nm to 1400 nm). Modern InGaAs detectors are typically two orders of magnitude more sensitive in the NIR than the older lead sulfide (PbS) detectors. The sphere InGaAs detector is at least 247X more sensitive at 720 nm from PMT to InGaAs detector. This is well over a two order of magnitude increase. The PMT to InGaAs change-over is selectable between 700 nm and 1100 nm with the optimal point at 860 nm. This is the wavelength range between the two blue arrows. An InGaAS detector is usable well into the visible wavelength region.
Note that this is not a precise comparison since the gain settings for a PMT detector and solid state InGaAs detector are not the conceptually identical. A lower InGaAs gain was employed to try and get as close to a match as possible.
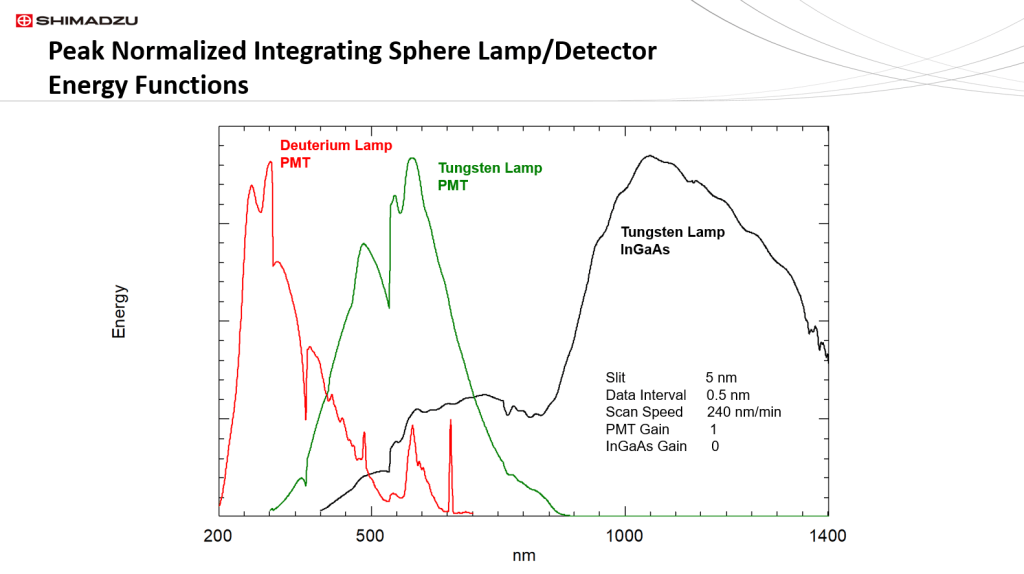
These are the same energy spectra that were displayed in the previous graph, except they have been “normalized” to the larger InGaAs detector peak value at 1050 nm. This is the reason for the lack of intensity values on the Y axis. This is done so that the shape and details of each detector region can be evaluated at full scale. Note that each lamp/detector combination has its own unique wavelength region of usefulness.
Note in the deuterium lamp PMT spectrum, there is a deuterium line emission spike at 656.1 nm. This line emission is often used to calibrate the wavelength and slit function of a spectrophotometer. Since it is a line emission property of deuterium, it will take on the half band width of the slit setting of the instrument.
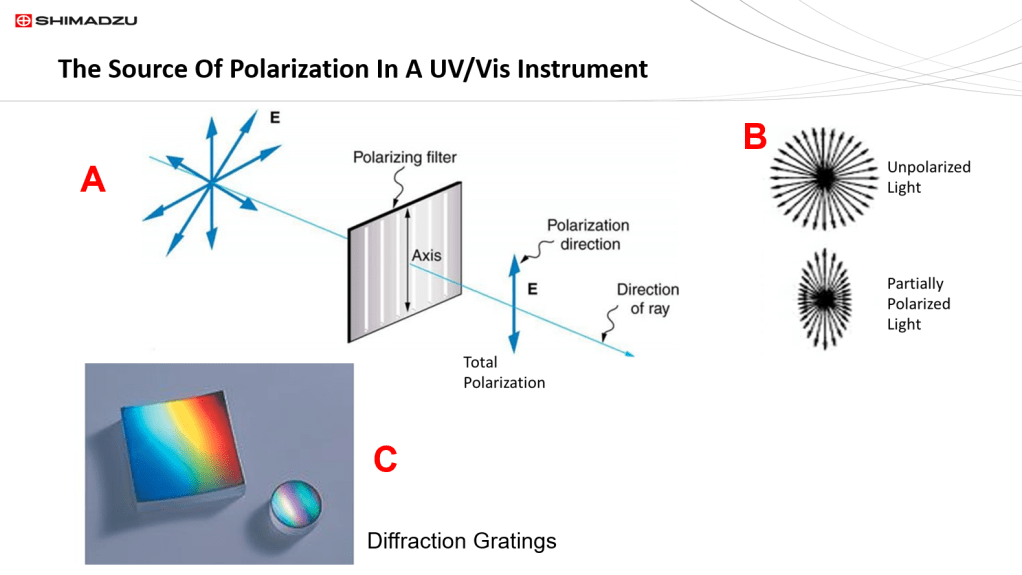
The diagram labeled A shows the production of 100% plane polarized light generated by a polarization filter. However, there are numerous processes that create partially polarized light where most of the light tends toward a single plane, but there are also other “residual” planes produced. Partially polarized light is shown in B where we are looking into the light beam and can see the difference between unpolarized and partially polarized light. Light is partially polarized when it reflects from a specular surface such as a mirror. The light from ANY diffraction grating monochromator is always partially polarized. The sources of this polarized light are the optics, both mirrors and the diffraction grating (C). Diffraction gratings tend to partially polarize light along the plane of the lines on the grating. This usually is not an issue when measuring solutions or isotropic solids such as a glass; however, this instrumental polarization can cause spectral artifacts when non-isotropic samples, usually solids, are measured. Since samples don’t come with labels on them saying, “caution polarizer”, it is therefore important for spectrophotometer operators to be able to identify possible polarizing sample material. We will now look one way to identify possible polarization artifacts that employs energy spectra.
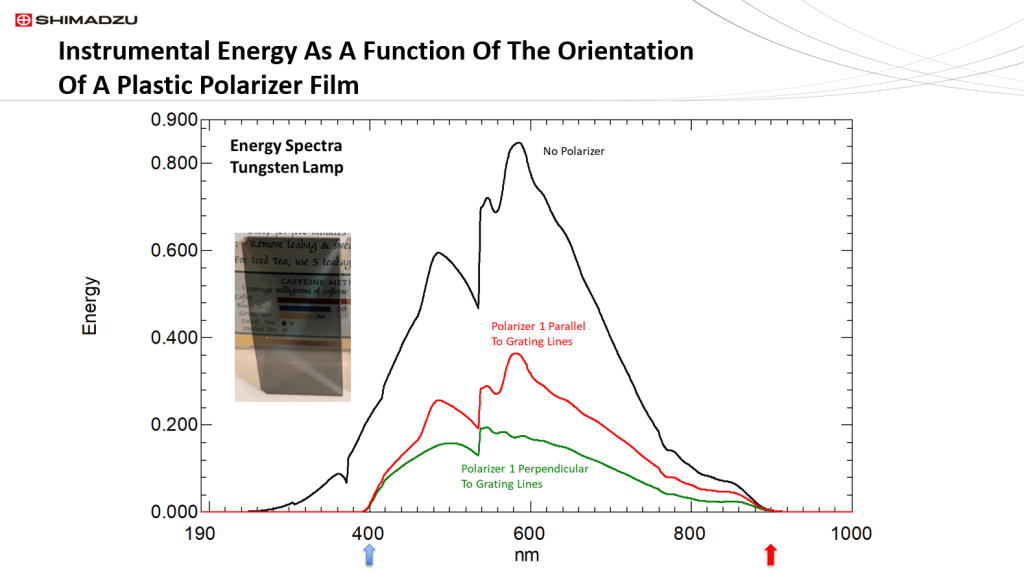
Because of the orientation of the lines on the diffraction grating of the instrument, instrumental polarization arises in the plane of the vertical grating lines. A plastic film polarizer, seen in the picture insert, will be measured at two perpendicular orientations in the beam. The figure here shows the energy spectrum without a polarizer in the beam in black. The red and green spectra are measured with the polarizer in the beam at 0 degrees and then rotated around the axis of the beam by 90 degrees. The red spectrum is measured with the polarizer parallel to the vertical grating lines, whereas the green spectrum is with the polarizer perpendicular to the grating lines. Two things to note, as expected the S polarizer orientation (perpendicular) is lower in energy to the P (parallel) orientation. Also, neither the S or P polarizer orientation total blocks the energy to 0, which is indicative of partially polarized light from the grating. If the light was totally polarized the green S orientation would have zero intensity values.
The blue arrow indicates the wavelength where the plastic polarizer substrate absorbs and blocks all transmitted light. The red arrow shows the long wavelength limit of the PMT detector.
Take home message: measuring grating S and P polarizer orientations in energy mode yields direct information on the polarization state of the spectrophotometer’s optics.
