Measuring Non-Liquid Samples
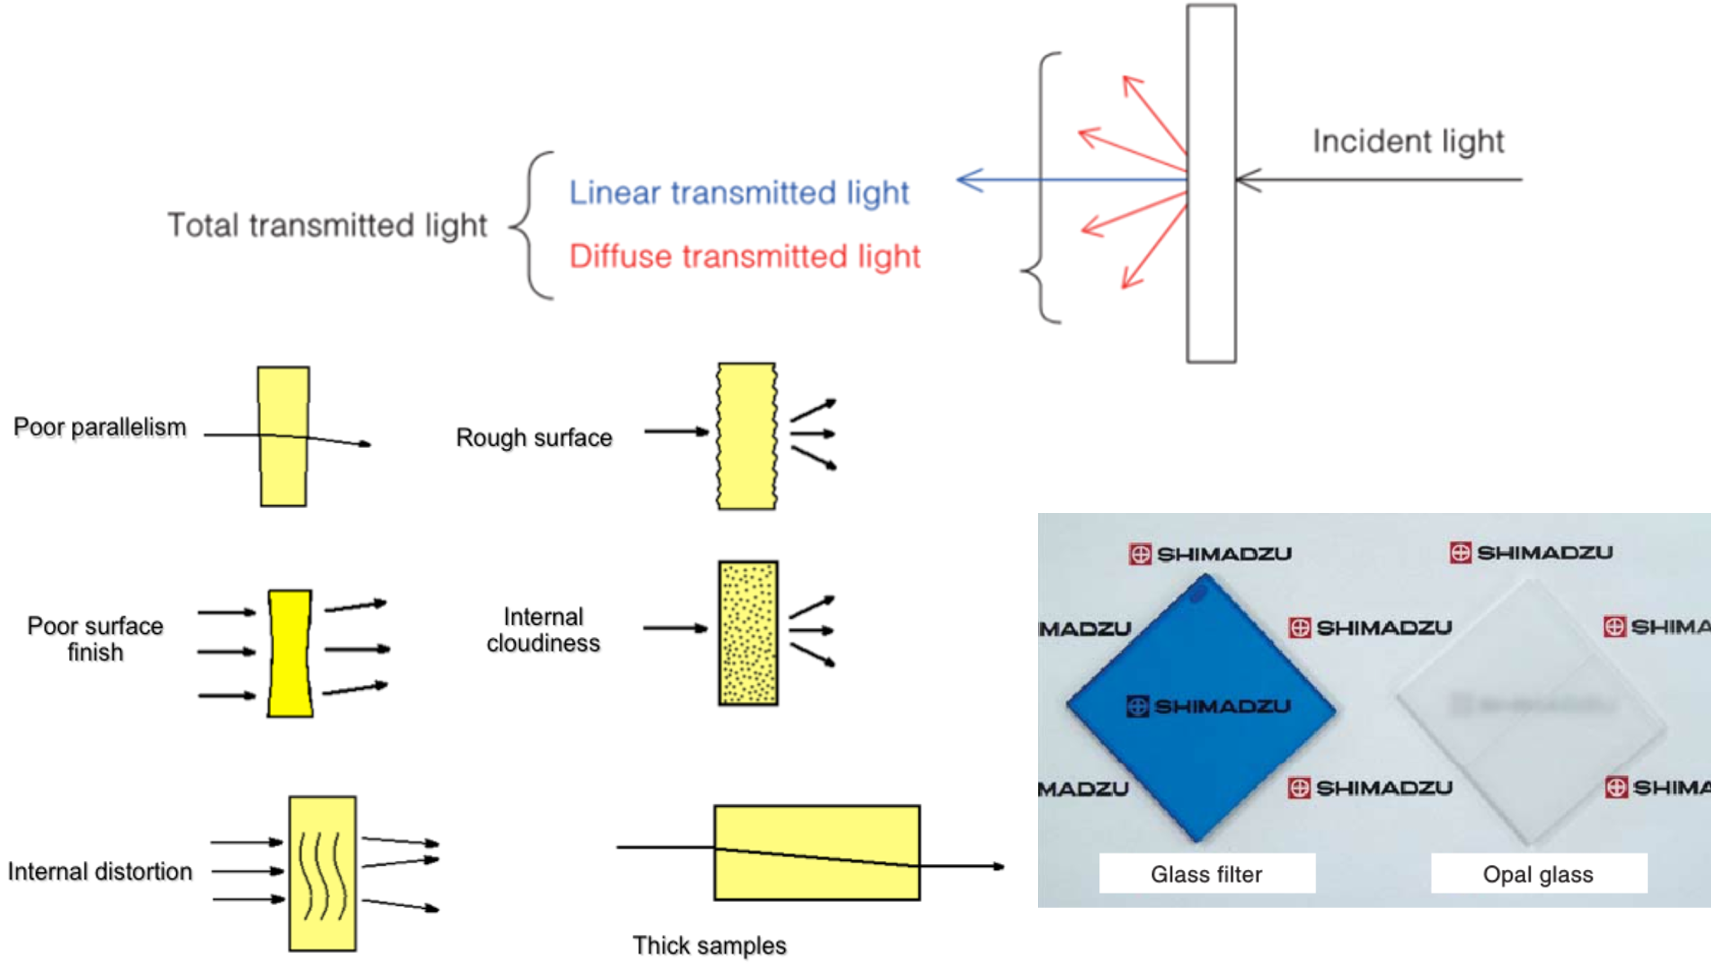
Transmission measurements involve shining light on a sample and measuring the light transmitted through it. The transmitted light is generally classified in three categories itemized below. A spectrophotometer equipped with an integrating sphere accessory is capable of measuring all three types.
- linear transmission measurements of light that passes straight through a transparent sample in a linear fashion (also called specular transmission)
- diffuse transmission measurements of light that is scattered by the sample when passing through it
- total transmission measurements of all the light transmitted through the sample.
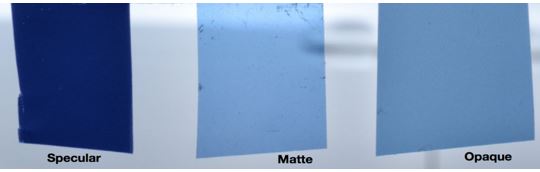
The characteristics of the spectra differ according to the type of sample being measured. Transparent samples like the glass filter seen below produce linear transmitted light. The opal glass sample is representative of a cloudy (hazy) sample that produces only a small amount of linear transmitted light, but a preponderance of diffuse transmitted light. The hazy nature of this type of sample is the result of scattered light exiting the sample via a multiplicity of angles. Light scattering can be caused by rough sample surfaces, internal cloudiness due to small particles, poor surface finish, and finally internal irregularities or distortions.
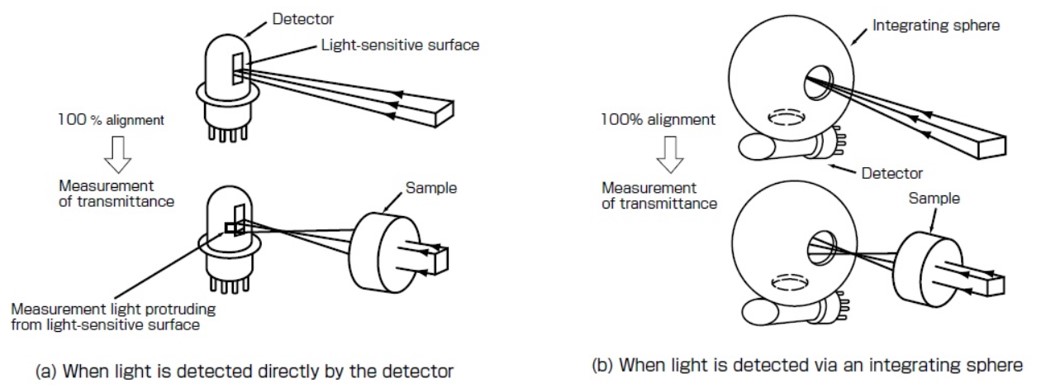
Just placing a solid sample into an instrument can cause artifacts which relate back to the nature of the background correction. When one measures liquid samples in a cuvette, a background correction is usually performed on a cuvette blank. This permits both cuvette and solvent to be corrected out of the sample in solution. Solid samples usually do not have a material available to measure for the background correction. As a result the background correction must be performed on an air blank. In the picture below at left we can see that the air background beam strikes the detector at a certain place, with a certain shape. When a solid sample is placed in the beam the beam shape and placement can be distorted due to sample path length and refractive index factors. In addition, beam distortions can also occur if the sample sides are not perfectly parallel and flat. The solution is shown below at right where an integrating sphere replaces the standard detector and is employed in transmission mode. The incoming light bouncing multiple times within the sphere (integration) makes all beam shape and placement issue go away. This is called using a sphere as a “collection sphere”. The only criteria in the use of a collection sphere is that all light from the sample must enter the sphere entrance port.
Demonstration Samples
The following discussion on samples measured on 60 mm and 150 mm spheres is not to show any particular sphere capability or proof statement on performance. Nor should it be seen as a method for “normalizing” spectra from different sphere sizes through the use of “fudge factors”. The conclusions inferred from the spectra are generalizations that apply to comparisons between sphere sizes and these conclusions should be independent of any particular vendor’s sphere. The object is to show the generalized influence of sphere size on spectra.
The two major factors related to sphere size that can affect spectra are port fraction (the percentage of sphere area not covered by the reflective coating) and integration capability (the number of bounces inside the sphere before the light reaches the detector). The port fraction for a 60 mm sphere is about 10%, whereas the 150 mm sphere is usually less than 4%. The CIE recommendation for the sphere port fraction is < 10%. The internal bounce number for a 60 mm sphere is about 10 to 15, whereas for a 150 mm sphere it is usually over 30.
Choosing the right evaluation samples is critical for this type of study. The samples evaluated were thin polymer films containing the same blue dye; therefore the qualitative shape of their spectra are similar. A large picture of the samples can be seen at the top of this post. They appear “different” to the human eye because of surface texture differences and dye concentration. They were selected to demonstrate sphere size effects on samples that are specular (clear and transparent), matte (hazy), and semi-opaque (little transparency).
The spectra for the transparent specular sample can be seen below. Note that for this type of sample there is little spectral variation between sphere sizes. Also the 60 mm sphere spectrum has uniformly higher %T values.
The matte sample below has considerably more light scattering ability. Note the much greater separation between the spectra from the two size spheres for this sample. Which spectrum is accurate?….. probably neither. All sphere measurements should be considered approximate rather than absolute. All integrating spheres must have holes to accommodate light entry into the sphere and they must also have non-coated areas to accommodate the detectors. As such, these areas allow light to escape measurement by the detector. The complex dance between port fraction and integration ability makes it very difficult to try and estimate the contribution for each property. The best one can due when comparing the transmission of significantly scattering samples between different sphere sizes would be to average the spectra for the best approximation.
The sample labeled opaque actually has some degree of transparency. Note that because of that opacity, the spectra have lower %T values. It also appears that this sample becomes more transparent above 750 nm in the NIR. The human eye can’t detect light beyond 750 nm so this transparency is lost on the human eye. Note that there is good agreement between spheres for the UV and visible regions. The most likely explanation for this agreement is that there is just much less light inside the sphere with this sample. This means that the port fraction and integration capability contribute less for a low %T sample; therefore leading to better sphere agreement.
There are several generalizations we can draw from this sphere comparison. 1) A 60 mm small sphere will tend to give higher %T values than larger spheres. 2) The greatest disagreement between spheres is generated by scattering transparent samples. 3) Low transmitting semi-opaque samples will tend to have better sphere size agreement.
Whenever comparisons between instruments are required, it is prudent to compare spectra from only the same size sphere. The color regulatory agencies agreed long ago to standardize on the 150 mm sphere size. This is not the result of that sphere’s spectra being more accurate, but rather, if everyone is using the same type sphere, the data will identical. There exist samples, such as prismatic glass used in solar cell envelopes, that require a 270 mm diameter sphere, or larger, to obtain reproducible spectra.
Never forget – all integrating sphere data is approximate.

Typically, diffuse reflectance is measured by two methods. The most common is to use an integrating sphere that is mated with a spectrophotometer, allowing the measurement of both transmitted and reflected scatter. The second is by use of the so-called biconical geometry, in which a mirror focuses a beam of light at a small point on a sample and the scattered reflected light is caught by a parabolic or similar curved mirror that directs the beam to a detector. Biconical devices do not collect scatter at all angles, so anisotropic materials are not measured accurately. For this reason, biconical devices are generally thought of as qualitative in nature, whereas an integrating sphere is both qualitative and quantitative. The advantage of a biconical accessory is that it allows one to get a spectrum on a far smaller sample than is required with an integrating sphere.
LikeLike