

Abstract:
Polarization measurements and polarization spectra are important applications for the materials characterization application area. Understanding the native polarization of a spectrophotometer’s light beam and how polarizing samples can interact with it is important in the generating of artifact free measurements. This study will elaborate on the possible polarization issues inherent in all spectrophotometers using diffraction grating monochromators. It will consider the artifacts that can be generated with samples that polarize light and how these artifacts can be eliminated. We will also look at how polarizers function and how polarizing samples can be identified so that proper measures can be taken to insure error free measurement. Lastly, the method used for generating S, P, and random polarization spectra will be discussed.
The spectrophotometer employed in this study is a Shimadzu UV2600 fitted with a 60 mm integrating sphere. The sphere has both a PMT and InGaAs detector for a wavelength range of 200 nm to 1400 nm.
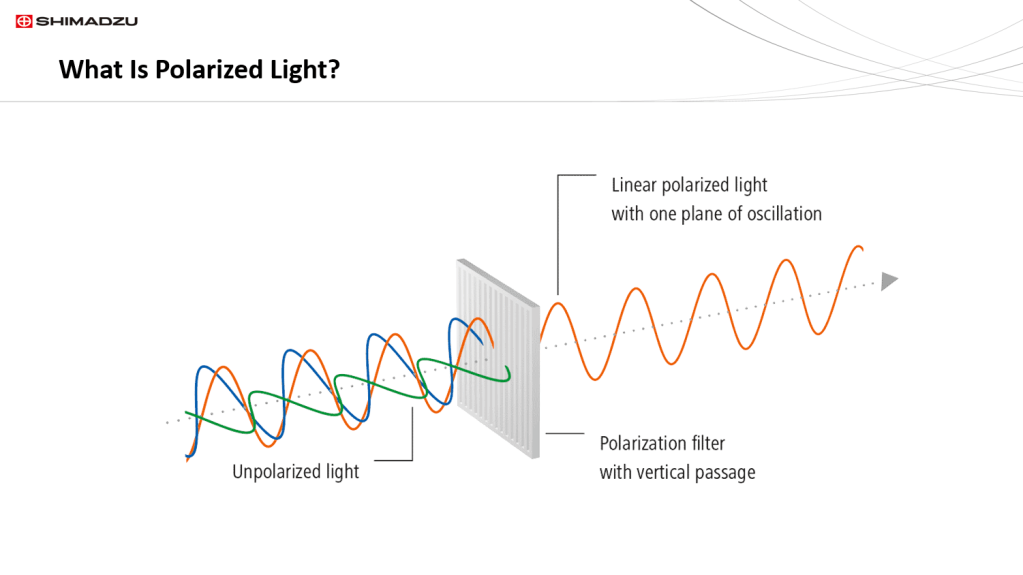
An electromagnetic wave such as light consists of a coupled oscillating electric field and magnetic field, which are always perpendicular. By convention, the “polarization” of electromagnetic waves refers to the direction of the electric field only. In linear polarization, the fields oscillate in a single plane. Light or other electromagnetic radiation from many sources, such as the sun, flames, and incandescent lamps consists of wave trains with an equal mixture of polarization planes; this is called unpolarized light. Polarized light can be produced by passing unpolarized light through a polarizer, which allows waves of only one polarization plane to pass. The most common optical materials (such as glass) are isotropic and do not affect the polarization of light passing through them; however, some materials, such as those that exhibit birefringence, dichroism, or optical activity, can change the polarization of light. Some of these are used to make polarizing filters. The graphic shown here demonstrates how unpolarized light is polarized into a single vertical plane.
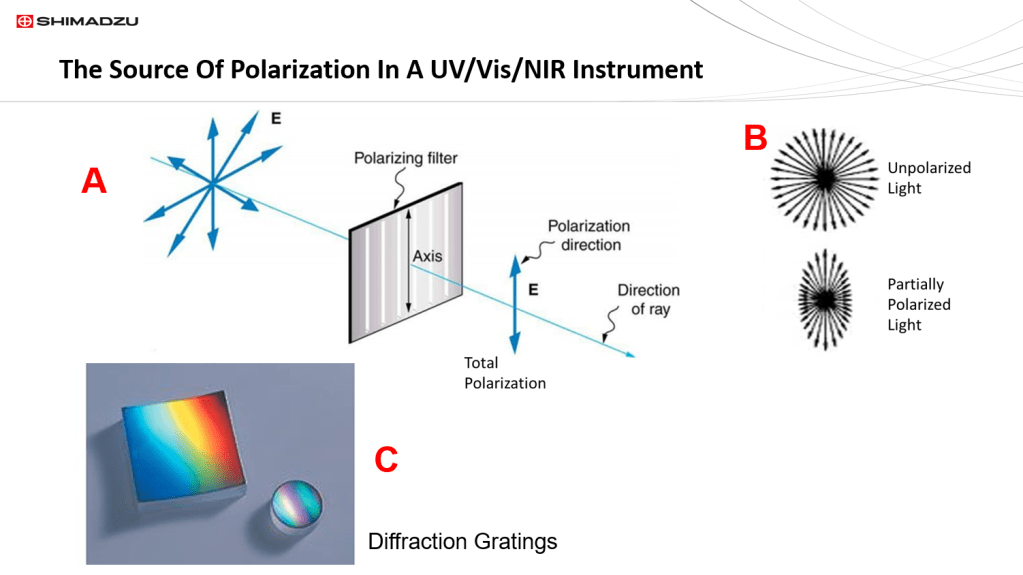
The diagram (A) shows the production of 100% plane polarized light generated by a polarization filter. However, there are numerous processes that create partially polarized light where most of the light tends toward a single plane, but there are also other “residual” planes produced as well. Partially polarized light is shown (B) where we are looking into the light beam and can see the difference between unpolarized and partially polarized light. Light is partially polarized when it reflects from a specular surface such as a mirror. The light in ANY spectrophotometer is always partially polarized. The sources of this polarization are the optics, both mirrors and the diffraction grating (C). Diffraction gratings tend to partially polarize light in the plane of the lines on the grating. This usually is not an issue when measuring isotropic solutions or solids such as glass. However, the instrumental polarization can cause spectral artifacts when non-isotropic samples, usually solids, are measured. Since samples don’t come with labels on them saying, “caution polarizer”, it is therefore important for spectrophotometer operators to be able to identify possible polarizing sample material. We will now look at ways to identify polarization artifacts so we can obtain accurate spectra.
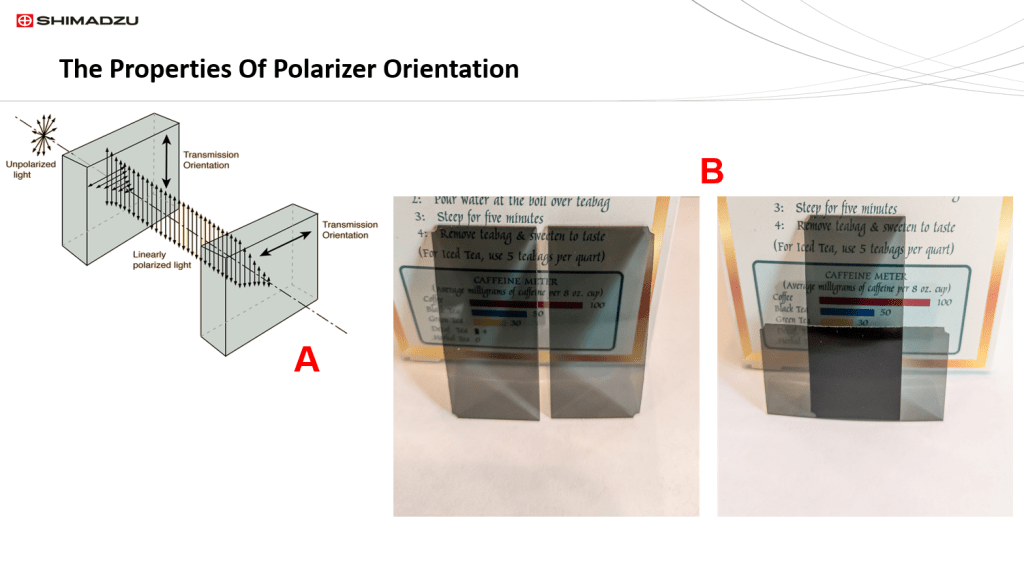
One of the easiest ways to evaluate a material for light polarization is to “cross” two materials and “see” what happens. In the diagram at A are depicted two polarizers in a beam of unpolarized light. The first polarizer selects for a single plane of polarized light. Now if a second polarizer is placed down-stream of the first, two things can happen. If the second polarizer is aligned parallel, which is designated as the P orientation, to the plane of the first polarizer, the polarized light is transmitted through the second polarizer. However, if the second polarizer’s plane is oriented perpendicular, which is designated as the S orientation from the German word senkrecht, to the first, all light is blocked. At B are pictures of two plastic film polarizers. As one can see, when you “cross” polarizers, no light gets through. This is a quick and easy test for polarization in any transparent material, however, please be aware this only works for materials that polarize visible light wavelengths detectable by the human eye (400 nm to 750 nm). Note that polarization is a wavelength dependent property and most materials only polarize light in a limited wavelength region. So for most samples a spectrophotometer will be necessary.
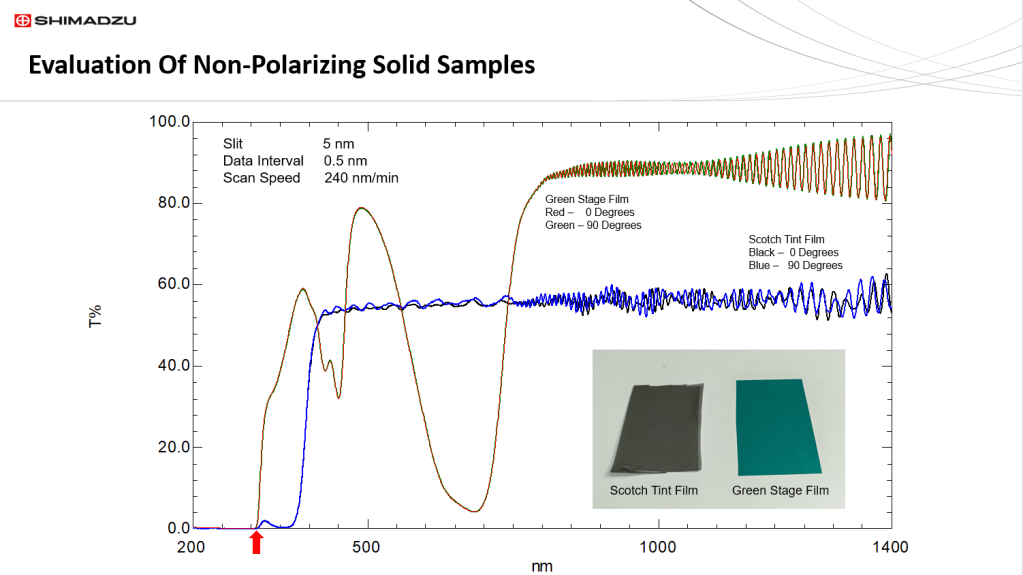
One of the easiest ways to evaluate if a sample polarizes is to measure spectra after the sample is rotated around the spectrophotometer’s beam axis. First the instrument is properly baseline corrected on air, then two spectra are collected, one before and another after rotating the sample by 90 degrees. Pictured here are the spectra of two solid sample films that could possibly polarize, a green stage filter and a tinted window film. Both have a transmission cut-off at the red arrow at around 310 nm. This is due to the plastic polymer nature of both films. Note that there is not a change in the spectra from the 0 to 90-degree sample rotation. Both materials generate interference fringes due to the thinness of these films, but this phenomena has nothing to do with polarization. The small differences in the fringe intensity and peak/trough wavelengths is most likely due to sample placement during rotation. So one can conclude, the native polarization of the instrument’s light has little, if any, impact on these samples, indicating their isotropic, non-polarizing nature.
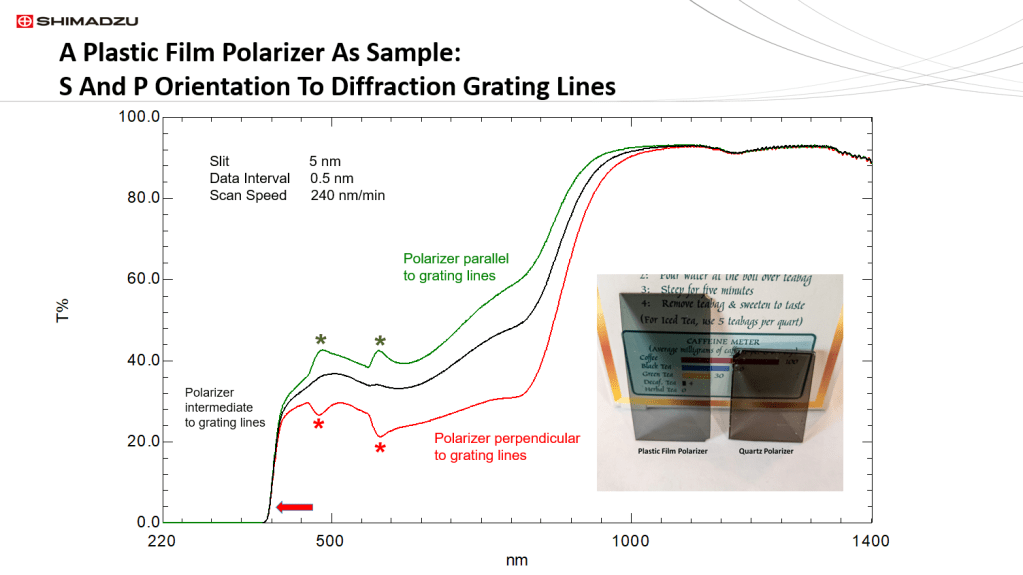
What happens when the same procedure is performed on a sample material that is known to polarize light? Shown here, on the left in the picture insert, is a plastic film polarizer. Since it is a plastic polymer it displays a transmission cut-off, at the red arrow, below 400 nm. One can clearly see a significant difference between the spectra after the sample is rotated in the beam. This is due to the partially polarized nature of the instrument’s light from the diffraction grating. This polarization region occurs between the 400 nm cut-off and a point around 1060 nm.
One can infer the polarizer orientation when parallel to the grating lines, P orientation, by the higher transmission values of the green spectrum. The perpendicular S orientation of the red spectrum results in lower relative transmission values. The intermediate black spectrum is the result of rotating the polarizer to aa angle estimated to be midway between the S and P orientations. As expected, the spectrum produced is in-between the two S and P extremes. Note the peak/trough structures designated by the asterisks in the spectra of the polarization S and P extremes. They are the mirror images of each other, but the intermediate black spectrum is lacking these same structures. This is typical of a polarizing sample with peak details.
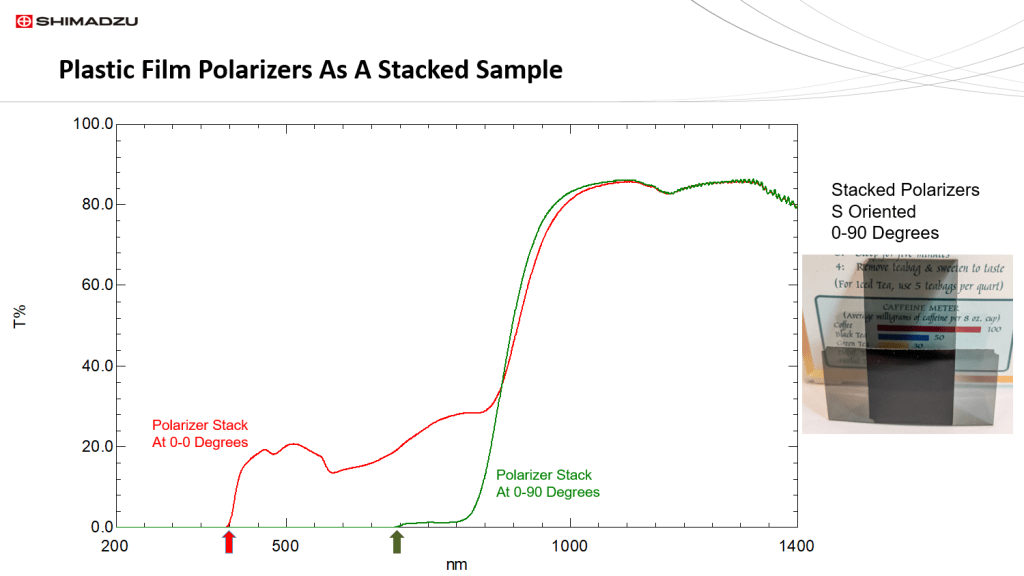
Another productive method of polarizer analysis, if one has two samples of the material, is to “stack” the two pieces at different orientations. The stacking requires the pieces to be oriented first parallel (P) to each other, either in a vertical to vertical or horizontal to horizontal positioning, and then measured on the instrument. After this spectrum is collected, one sample is rotated 90 degrees perpendicular to the other (S) for a vertical to horizontal orientation and measured. The S sample stacking can be seen in the picture here at right.
The P orientation stack’s spectrum is shown in red and represents the wavelength dependent transmission of the sample material. Note the plastic transmission cut-off is clearly shown below 400 nm at the red arrow. The S orientation stack’s spectrum is shown in green and indicates the amount of polarization from the sample. This S spectrum’s zero transmission values, between the red and green arrows, indicate a total rather than partial sample polarization between 400 nm and 800 nm. Above 800 nm this sample becomes a variable partial polarizer which is defined by the non-zero transmission values of the P configuration stacked spectrum in green.
This procedure allows for the assessment of the total or partial polarization nature of the sample material even though the instrument’s beam is partially polarized.
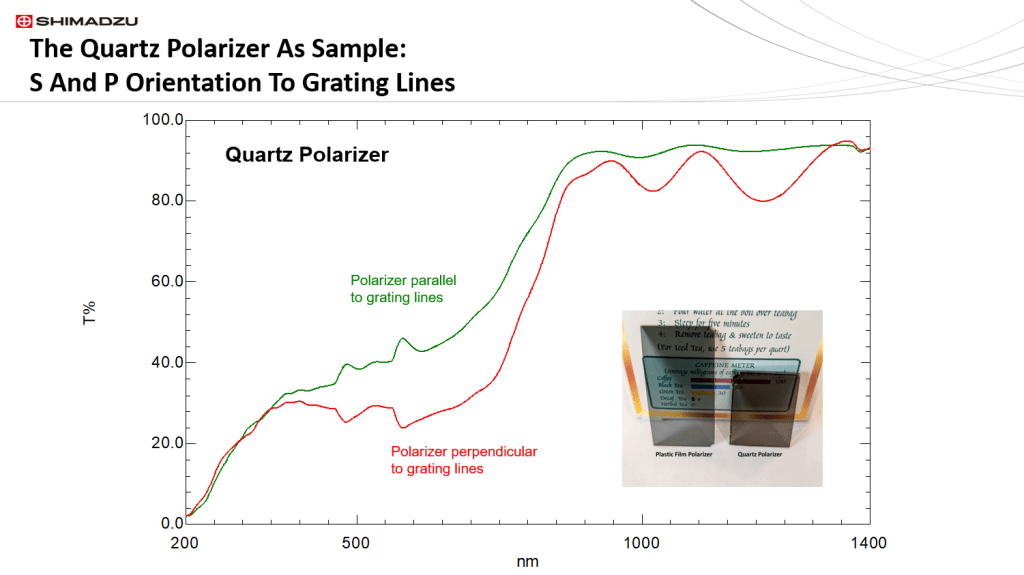
We will now consider a companion sample to the plastic film polarizer that employs the same polarizing material, but it is coated onto a quartz substrate rather than plastic. It can be seen to the right of the plastic polarizer in the picture insert above. The spectra shown here were obtained by baseline correcting the instrument on air and measuring the quartz sample at two perpendicular orientations around the beam. The quartz sample, as expected, has lower wavelength transparency to 210 nm as compared to the 400 nm cut-off in the plastic film polarizer. Since the polarizing material is the same for both the plastic and quartz polarizers, the polarization spectra appear similar, even down to the similar two mirror inflection points around 500 nm in the above spectra. One interesting feature of the quartz polarizer is the loss of polarizing ability below 290 nm. This may also be happening in the plastic polarizer, but the plastic transmission cut-off below 400 nm hides this information.
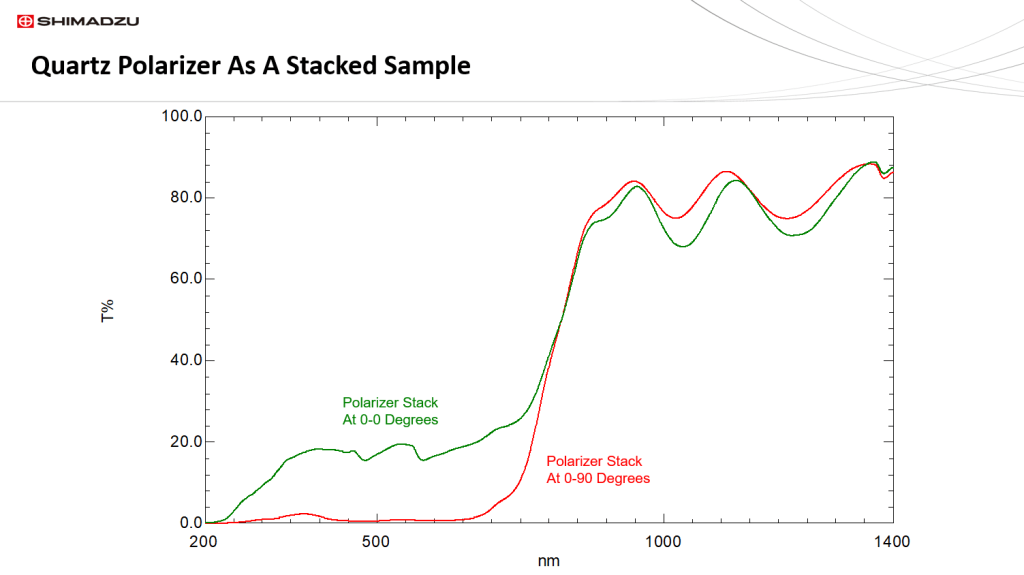
The analysis of the stacked quartz polarizer pair indicates that it is not a very good polarizer, even though it is transparent down to 210 nm. As indicated from the perpendicular orientation (S) stack spectrum shown in red, the wavelength region of maximum polarization between 700 nm and 210 nm is partial in nature due to the 1 to 5 %T values of this spectrum.
The parallel (P) stack spectrum is shown in green. The wavelength region above 900 nm is significantly different from the plastic film polarizer. The plastic film sample was relatively flat in this region; whereas, the quartz polarizer has three significant undulations here. There is an interesting cross-over point at 800 nm that may be due to partial polarization of the beam radiation.
