Abstract:
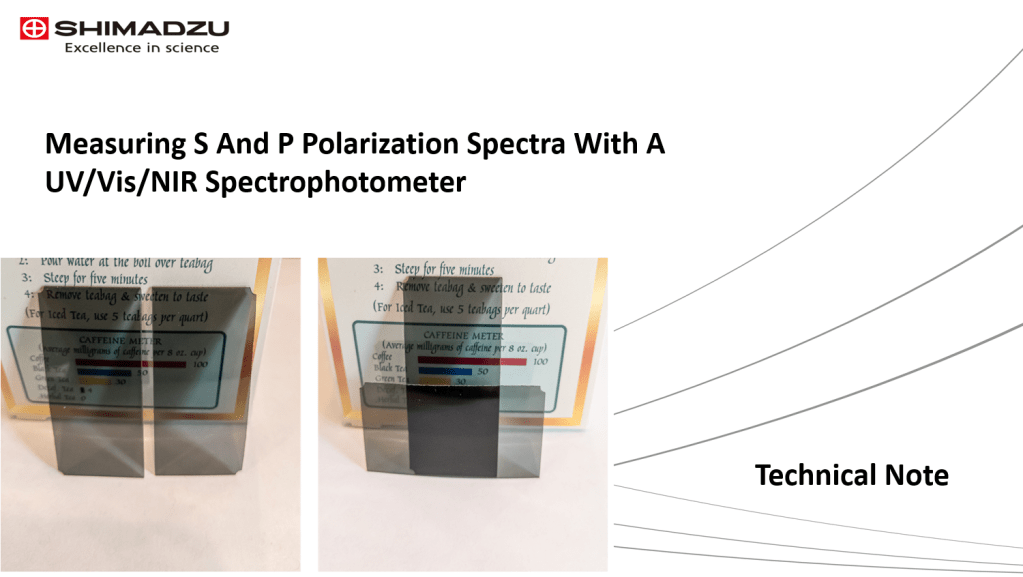
Polarization measurements along with polarization spectra are important applications for the materials characterization application area. In this short post we will discuss the methods used for generating S, P, and random polarization spectra on a typical UV/Vis/NIR spectrophotometer. The spectrophotometer employed in this study is a Shimadzu UV2600 fitted with a 60 mm integrating sphere. The sphere has both a PMT and InGaAs detector for a wavelength range of 200 nm to 1400 nm.
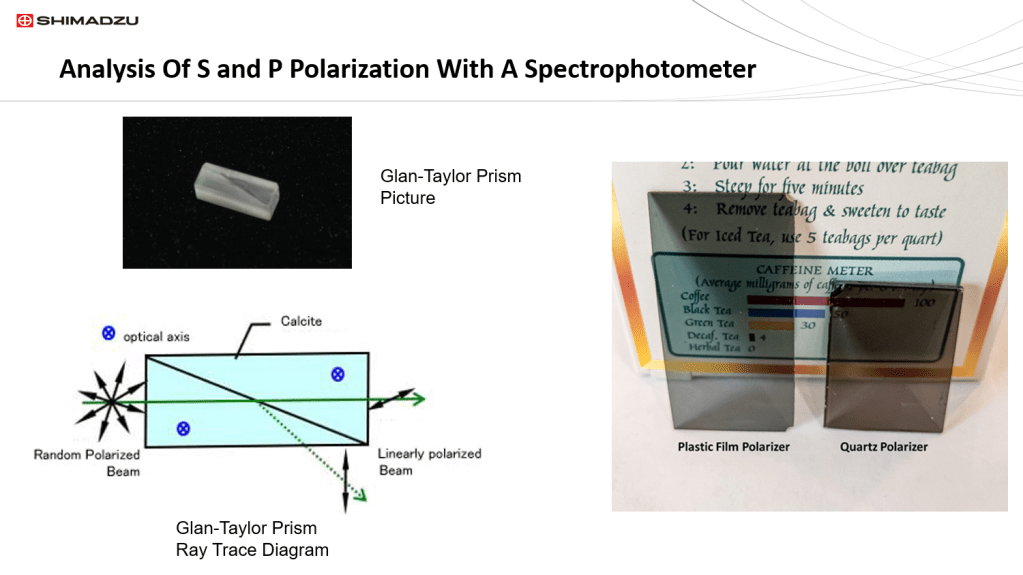
In order to measure S and P polarization with a spectrophotometer, you need to have an analysis polarizer in the instrument before the sample. This polarizer selects for only one plane of light to interact with the sample; thereby, eliminating any partial polarization artifact due to the instrument’s beam. Typically analysis polarizers are calcite Glan-Taylor or Glan-Thompson crystals. Glan type polarizers typically have high light throughput as well as a total polarization extinction of six or more orders of magnitude. For any polarizer being used for S and P analysis one should always check for the useful wavelength range of that polarizer.
For our study, we will use the plastic film polarizer as the analysis polarizer. As such, only information between 400 nm and 800 nm will be considered since this is the useful total polarization wavelength region for this film. The quartz polarizer will be the sample material.
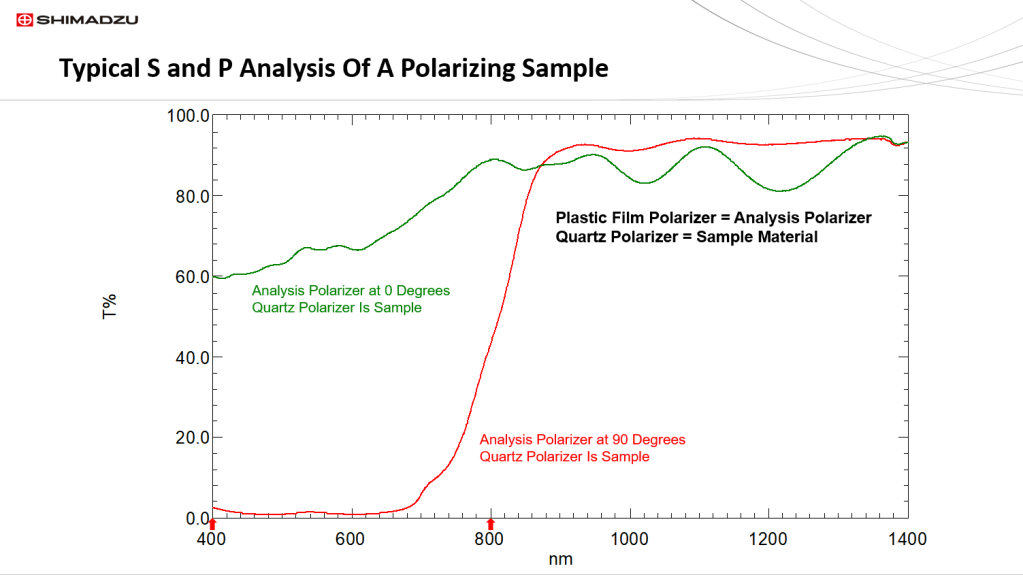
The S and P analysis procedure first involves baseline correcting the instrument with the analysis polarizer in place and the sample removed. It is also necessary to baseline correct the instrument before sample measurement for each position of the analysis polarizer at 0 and 90 degrees. The graph presented here employed the plastic film polarizer for the analysis polarizer positioned prior to the quartz polarizer sample. Two spectra of the sample are collected. It is important that the sample be placed in the beam the exact same way for both measurements. The P orientation spectrum in green and the S orientation spectrum in red are presented here. Since our plastic analysis polarizer is limited to the wavelength range of 400 nm to 800 nm, only the region between the red arrows is accurate. The quartz polarizer analysis indicates it is best between the wavelength range of 400 nm and 700 nm, but it is still only a partial polarizer even in this region.
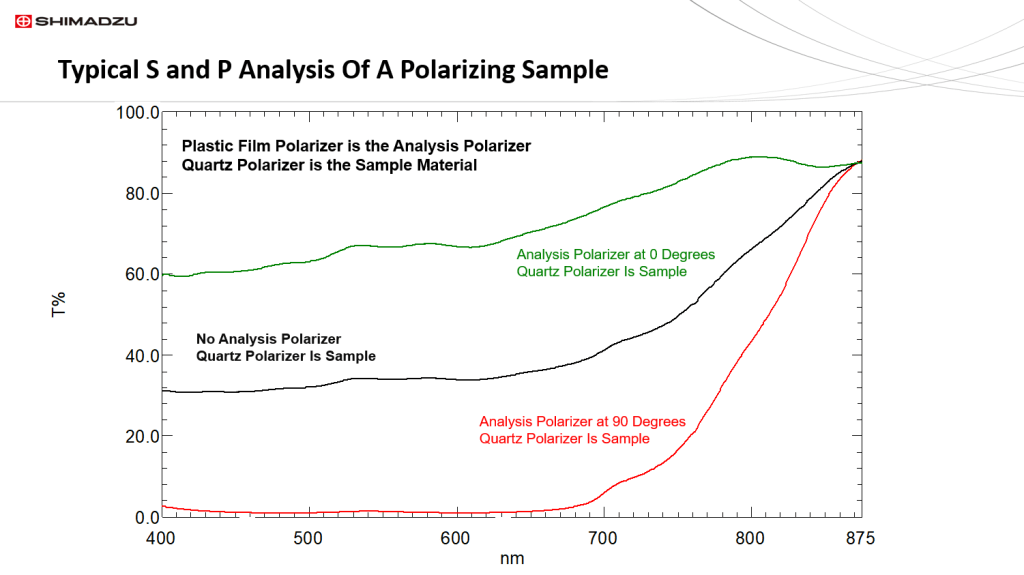
Presented here are S configuration spectrum, P configuration spectrum, and unpolarized spectrum for the UV/Visible region of the quartz polarizer sample. This sample is clearly a material that only partially polarizes. The spectral order is typical with the P spectrum in green the highest transmission, while the S spectrum in red has the lowest transmission values. Also the unpolarized spectrum in black is midway between the S and P spectra. In fact, if the native polarization of the instrument is removed totally, the unpolarized spectrum should be the mathematical average of the S and P spectra. This means that the S and P spectra should never cross over each other, but if they do, the instrumental polarization was not removed properly.
Some investigators might employ a depolarizing, or scrambling filter placed prior to the analysis polarizer to remove the native polarization artifact of the instrument, but this is not critical. Baseline correction should be performed with the depolarizing filter, if present, and the analysis polarizer in place, but no sample
The sample is only a partial polarizer since the red, S orientation spectrum, approaches, but never reaches 0 %T between 400 nm and 800 nm, the useful wavelength range of the film analysis polarizer.
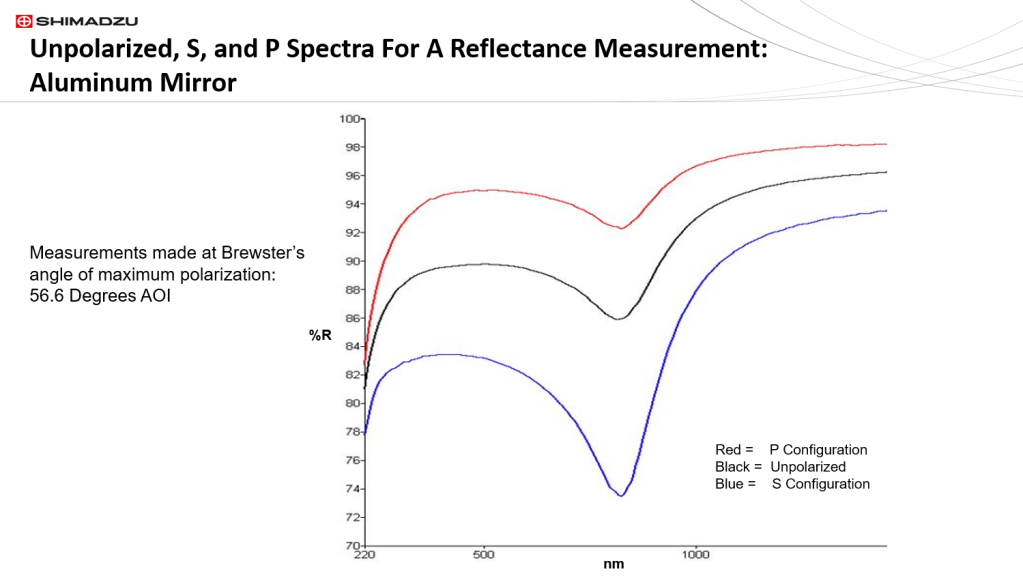
Presented here are S configuration spectrum, P configuration spectrum, and unpolarized spectrum for the specular reflection of an aluminum mirror.
The instrument they were measured on was equipped with a depolarizer filter to remove the native polarization artifact and a Glan-Taylor analysis polarizer with a usable wavelength range between 220 nm to 2000 nm. Reflectance is always only partially polarized. This is true for all metallic surface reflections where the degree of polarization is angle of incidence (AOI) dependent. Typically AOI’s that are near normal lack any polarization. As the AOI rises above 15 degrees, the polarization of reflected light increases to a maximum at Brewsters’s angle, which is 56.6 degrees for aluminum.
The spectral order above is typical, with the P spectrum the highest reflectance, while the S spectrum has the lowest reflectance. Also the unpolarized spectrum is typically midway between the S and P spectra. In fact, if the native polarization of the instrument is removed totally, the unpolarized spectrum should be the mathematical average of the S and P spectra. This means that the S and P spectra should never intersect, and if they do, the instrumental polarization was not removed properly.
